


Serverless services, such as AWS Lambda, are tempting us with the promise of automated and effortless scalability. They are designed to easily scale to unbelievable levels, quickly adjust to the upcoming workloads, and to run in an environment highly abstracted from the hardware underneath. All those traits make it very easy to think about the optimization of your services as a second-class citizen. After all, Lambda will just scale up when needed, so why spending time and money on optimization?
Don’t think servers, still think performance
As many others have said: “serverless” does not mean no servers. Instead, as noted in the AWS docs, serverless is more a question of not having to think about servers. While a serverless approach can simplify some computing tasks, the need to understand and maintain application performance remains as important as ever.
While Lambda scaling capabilities are indeed very powerful (you can read more about Lambda features, including scaling, in my previous article), optimization details and techniques might not be so obvious for people used to working with more traditional applications.
Time is money, literally
There is one major difference in how we think about optimization in Lambda-based applications. In a standard server-based applications, the cost of a running server is more and less constant. You pay for hours of running server instance, the price does not change if you are able to process the upcoming requests in 100 or 500 milliseconds. Of course, it will affect your users experience, and can limit your maximum throughput, but it will not affect your costs.
With Lambda it's different. You pay for what you use, you pay only for the time your code executes, this is an opportunity for great savings (you don't pay for idle time, when your code is not executing), but it also means, that longer execution directly increases your AWS bill.
In case of Lambda, you are also billed for each invocation. While the price for the single invocation is very low, a sudden peak in number of requests might put a significant pressure on your credit card.
There are different ways you can optimize your lambdas to reduce the execution time and decrease your costs, but before we discuss them, let's take a look how AWS bills you for Lambda execution.
How to calculate Lambda cost
Lambda service charges you for every Lambda request (function invocation) and for the time your code is executing. The prices may vary depending on the region and AWS might change the price table from time to time.
Currently in eu-west-1 region, the cost of a single Lambda invocation is $0.0000002. As for the execution time, it is calculated as GB-Seconds. GB-Second simply represents a one second of execution time, of Lambda that is using 1 GB of memory and will cost you $0.0000166667
Execution time is rounded up to the nearest 100 ms, so even if your function is execution for 230 ms, you will be billed for 300 ms.
Free Tier Package
AWS gives you an initial Free Tier for Lambda functions, that includes 1M Requests and 400,000 GB-Seconds per month for free. What's more, Lambda Free Tier does not expire after 12 months of AWS Free Tier term, but is available to both existing and new AWS customers indefinitely.
That means that services with relatively small workload can be completely free and not generate any costs on your bill (at least not for Lambda service).
Calculating cost by memory
Let's now see on how GB-Seconds are calculated.
As stated above, 1 GB-Second represents a 1 sec of execution of a function that has 1 GB memory assigned to it. If the function has a smaller memory footprint, it will use a fraction of this resource. Let's say we have a Lambda function that has a 512MB assigned to it, it means that 2 seconds of its execution time is worth 1GB-Second. Analogically function using 256MB of memory has to run for 4 seconds to use 1 GB-Second and using 2048MG (2GB) can only run for 0.5 sec.
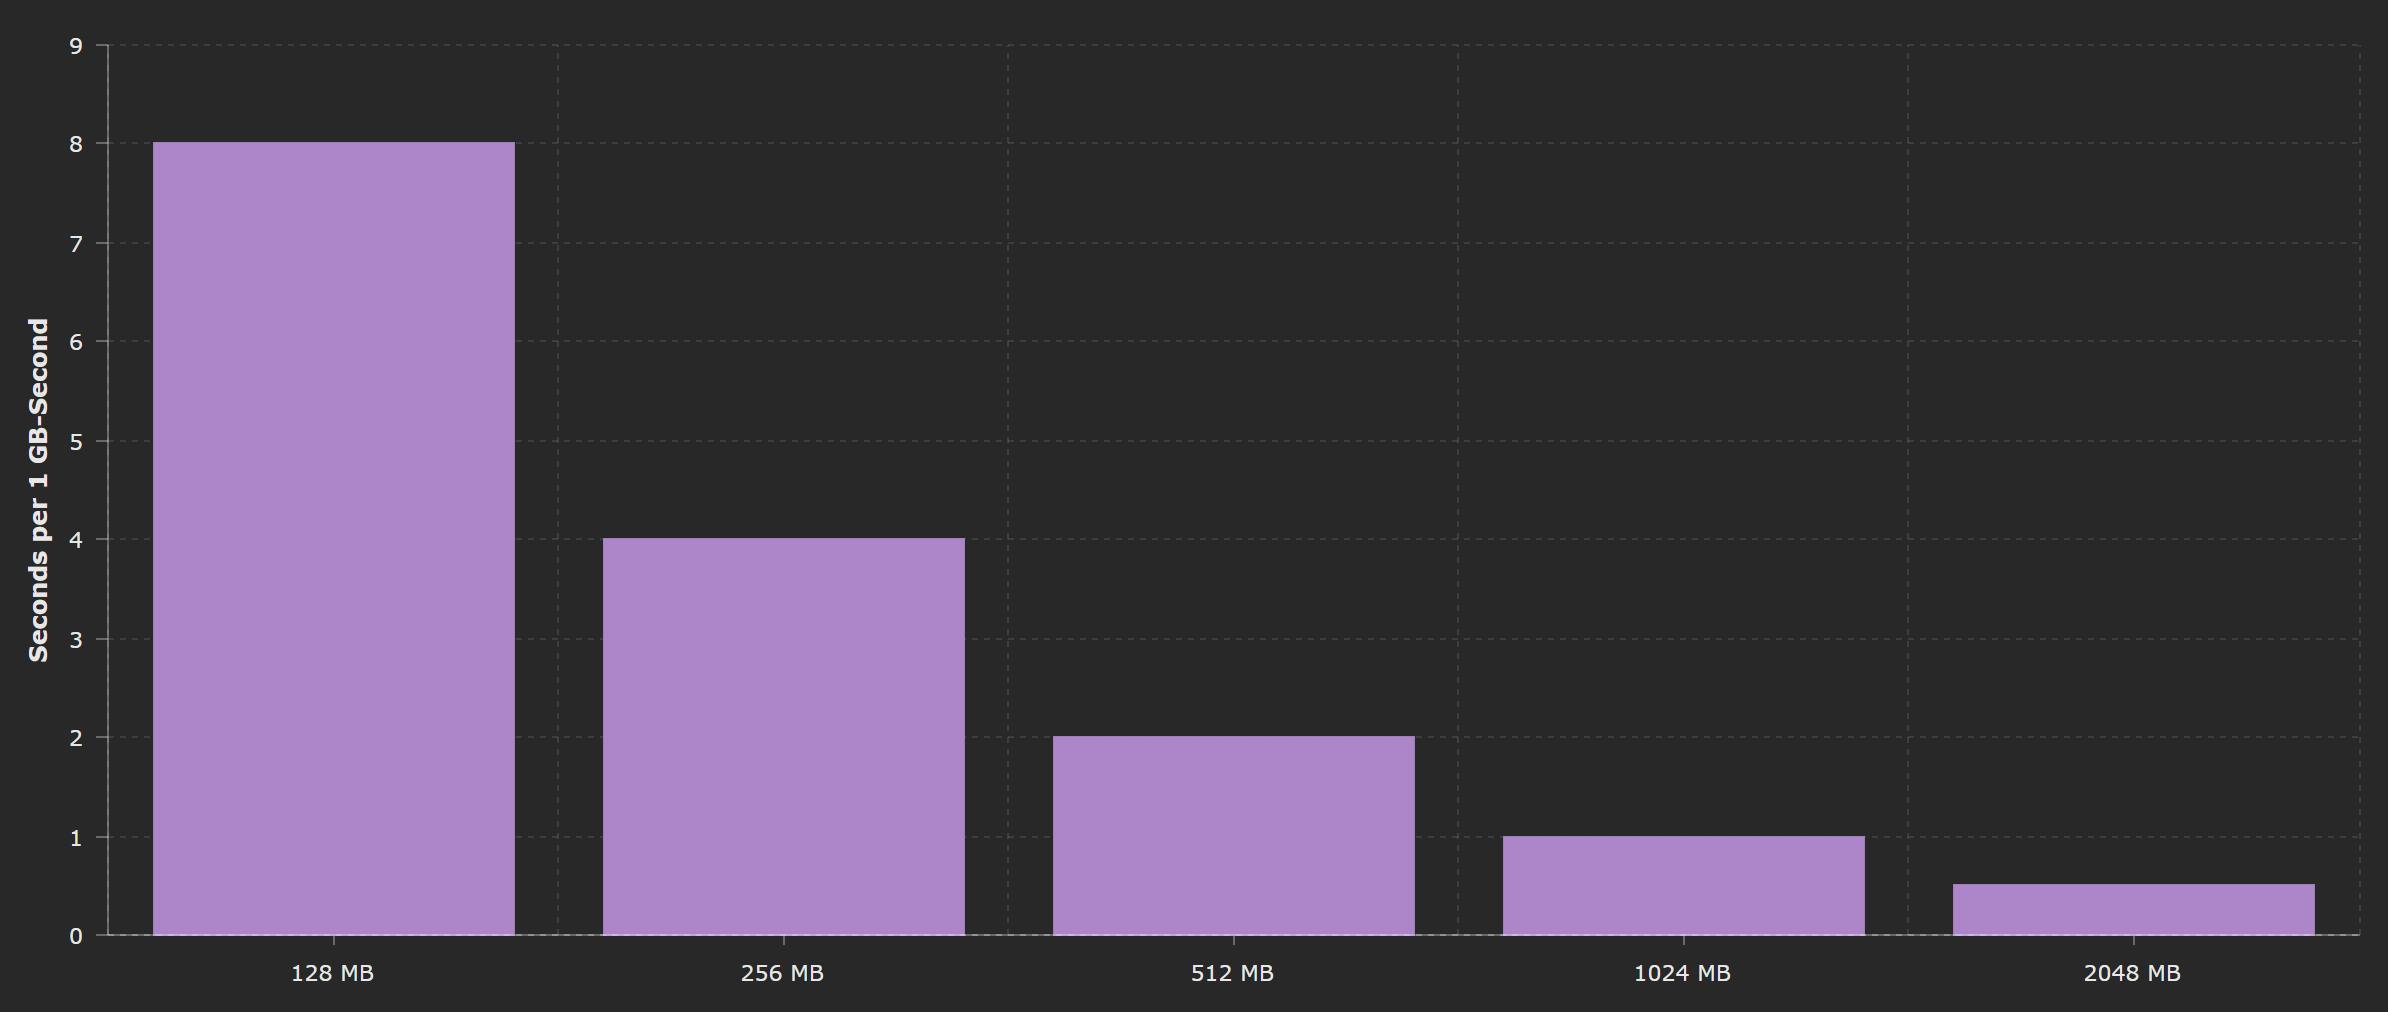
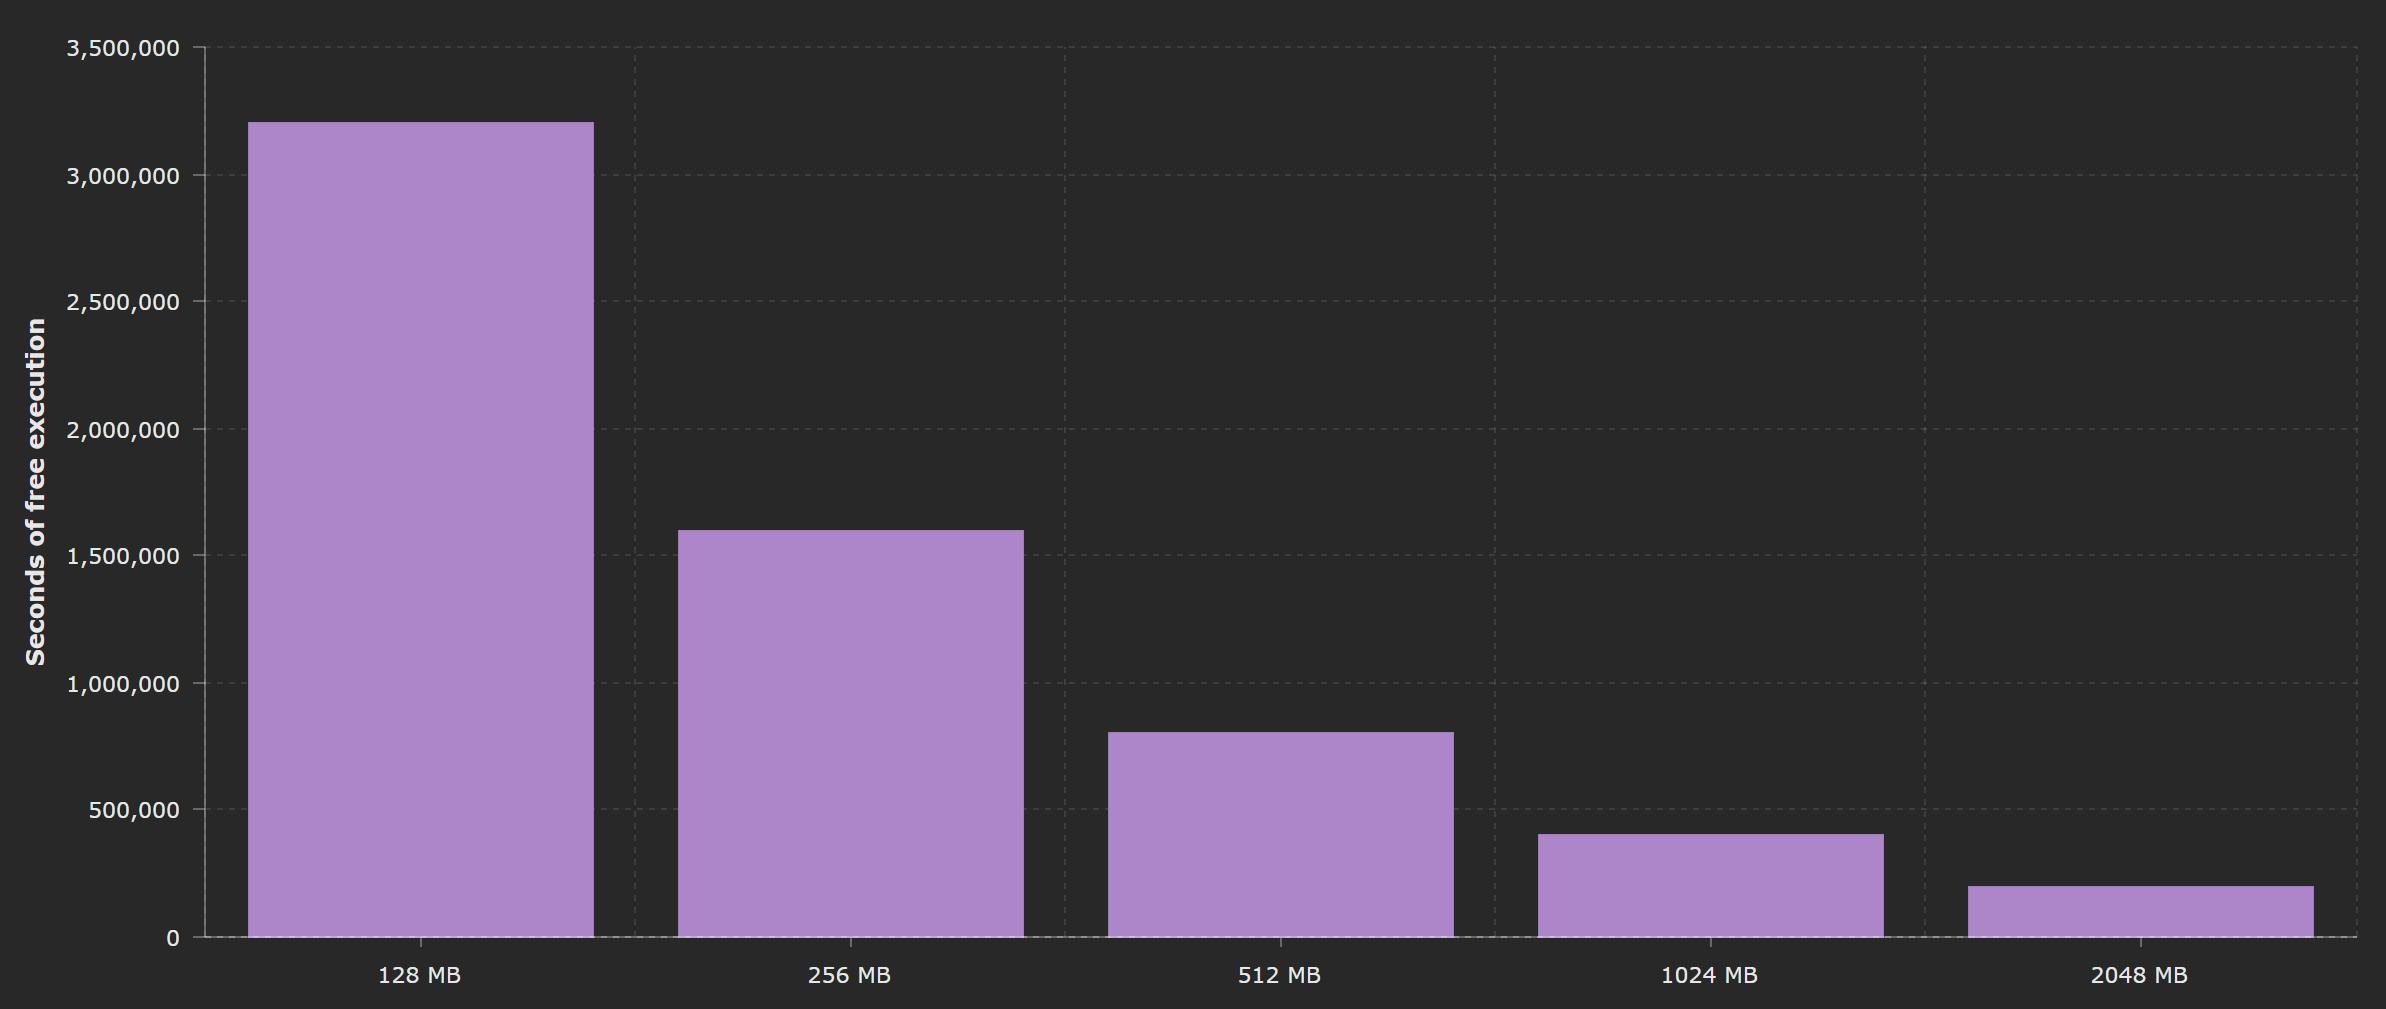
Those rules applied to the usage of available free tier as well. You can run 1GB functions for 400,000 seconds for free, but if you only run functions with 128 MB footprint, you will have as many as 3,200,000 seconds to use before you will start seeing charges in your bill.
In reality of course your functions will have different footprints, depending on the tasks they perform, just remember to not to over provision function's memory, since even if not fully used, it will increase your costs.
Measuring Lambda performance
The first step in all optimization-oriented discussion is knowing how to measure it. Every optimization, without proper metrics, is just an academic discussion, that does not have to apply to the real world use cases. Remember to always measure and track the performance of your Lambdas, and verify if the applied changes are actually providing you with real benefits.
Fortunately, AWS provides us with a rich set of monitoring tools, well integrated with Lambda service.
Cloudwatch
Cloudwatch is undoubtedly number one tool that we can use to track the performance and costs of our Lambda functions. It provides us ability to review the execution details of our function, ona various level of details.
Logs
Every Lambda function sends execution details (and and any custom log messages that you add) to Cloudwatch, where logs are stored and available for analysis.
At the end of every execution log, you can find the performance information. Time execution, memory usage etc. are simply displayed in the log entry.
This is a very basic information, but often it's enough to evaluate your function performance.

- Duration - how much time your function was executing
- Billed Duration - the time that you were billed for, Lambda rounds up time execution to the nearest 100ms
- Memory Size - The amount of memory assigned to this Lambda function
- Max Memory Used - The amount of memory used by your function during this execution
For some execution you might also see Init Duration, this indicates that the function was cold started, and gives you an overview of how long the initialization code was executing.

Logs unfortunately only provide us with information about single lambda invocation at once. In order to track our service performance on a scale, we need some more advanced solution.
Monitoring
Cloudwatch provides also set of metrics that allows us to track what's happening with our functions in real time and review the historical data.
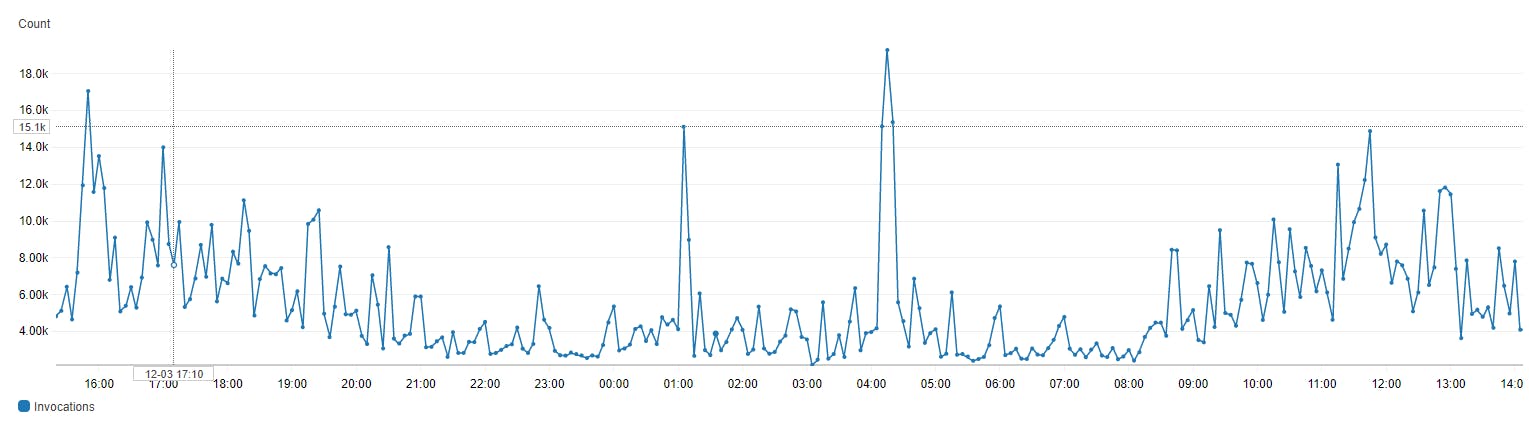
Number of invocations
Number of invocations is a build in metric that is able to track number of invocations per Lambda function. You can adjust the time range you want to visualize, display multiple functions at once, or even adjust the granularity of the graph.
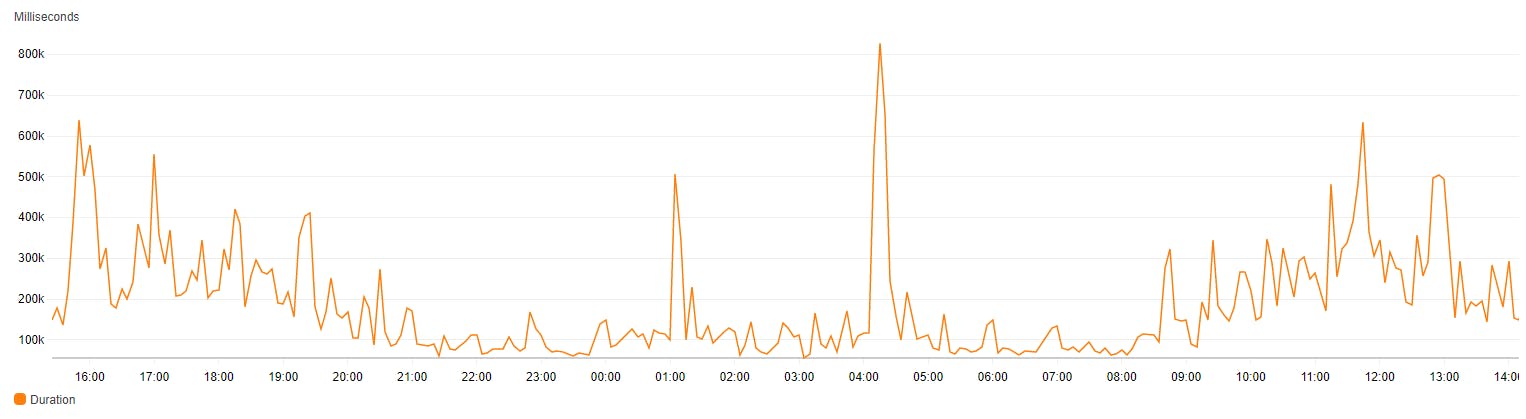
Execution time
The same way you visualize invocations, you can visualize execution time of the function. Depending on the situation and your workload, you might want to view the Maximum execution time, not average, this might help you find the bottlenecks or unexpected code issues.
The above methods are only a small piece of Cloud Watch functionality, still it's should be sufficient for the needs of this article. However I encourage you dive deeper in to this service and explore it's features on your own.
X-Ray
AWS X-Ray is service designed to analyse and debug distributed applications, that spread across multiple lambdas and services, to identify and troubleshoot issues and errors. While it's main purpose is much wider than Lambda performance testing, we can still use some of it's features to visualize interesting parts of Lambda execution.
Activation
To use X-Ray tracing for Lambda function, you have to enable it in AWS Console.
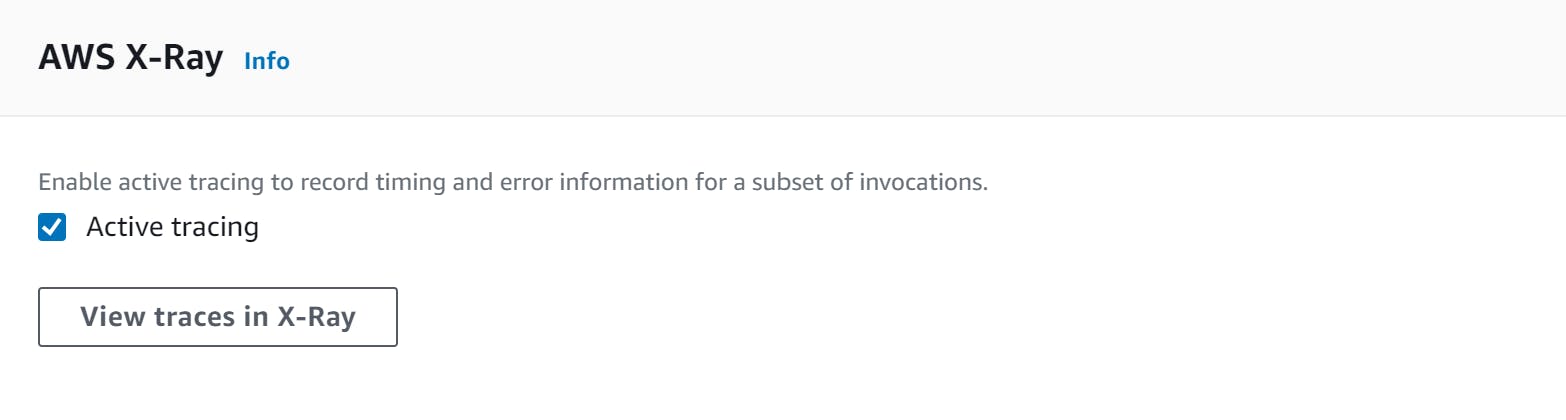
After that, you will be able to find your Lambda tracers in X-Ray panel.
Lambda Trace
Trace details view allows you to investigate what happens during your function execution and investigate how long particular invocation steps last.
It's especially useful to spot performance problems with Lambda cold start and initialization phase.
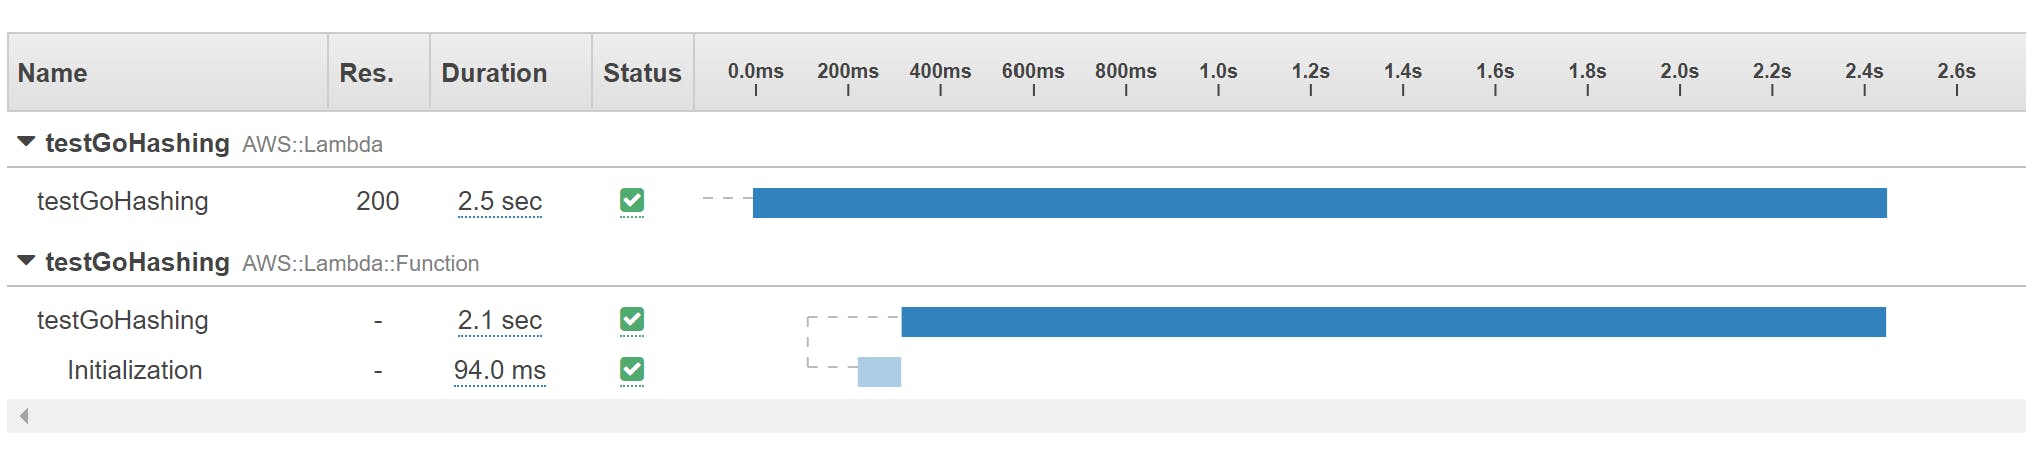
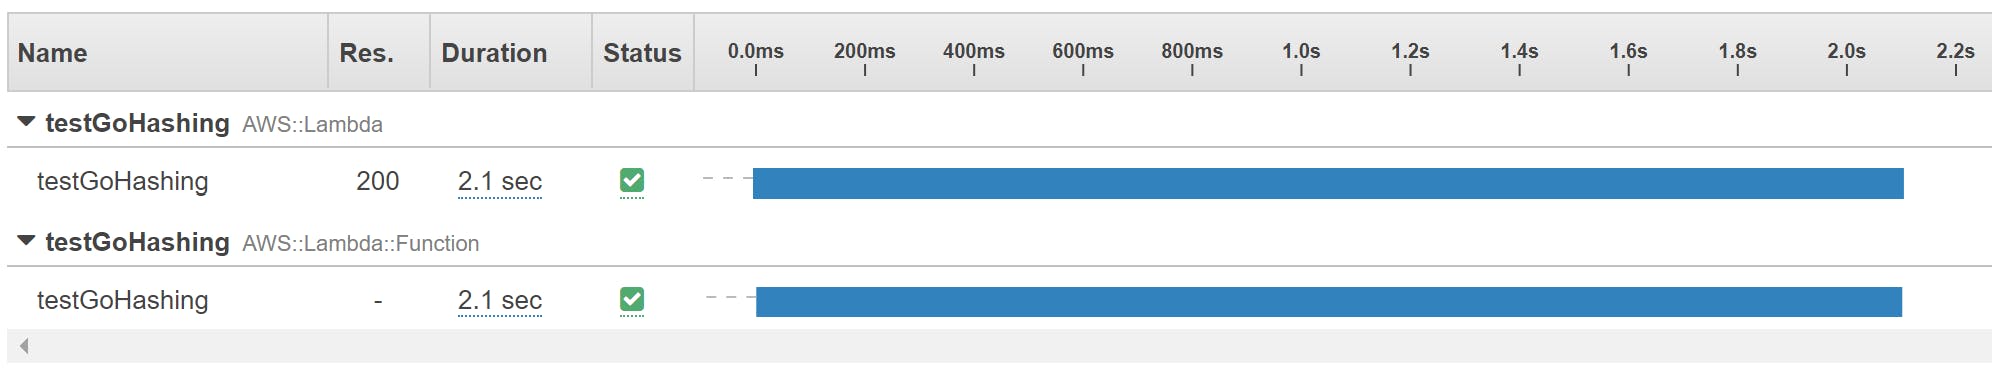
You might also notice, that subsequent Lambda invocations, warm starts, do not have Initialization segment, since the initialization code is not run for those cases.
Now, knowing how to measure the performance of Lambda functions, let's review the techniques that can be applied to get performance boost.
Optimization techniques
As you might expect, there are multiple optimization aspects that apply to Lambda functions, let's review them one by one.
Optimization through configuration
Your Lambda code does not have direct access to the processor, instead, it gets assigned part of the virtual CPU. How big is this part, depends on the amount of assigned memory, starting with a small chunk at 128MB to 1,792 MB where Lambda gets the full vCPU core. Above that level, additional vCPU cores will get assigned to your function. Amount of assigned memory also affects your billing, the more memory you assign, the more you will pay for every 100 ms of execution.
Assuming your function execution time is limited by CPU power, you can actually consider increasing the amount of assigned memory, so that your function execution time is shorter. Overall you might be billed the same amount of money (or even less) and your function will return results faster.
Code optimization
Usually, there is no magic here. Lambda execution, on the code level, is similar to any other code execution, so as a rule of thumb, you can assume that whatever makes your code run faster on your machine, will make it run faster in Lambda as well. Countless optimization techniques apply here, more efficient algorithms or nifty code tricks. There are however, two unique cases, that might require some more customized approach: asynchronous operations and multithreading.
Asynchronous operations
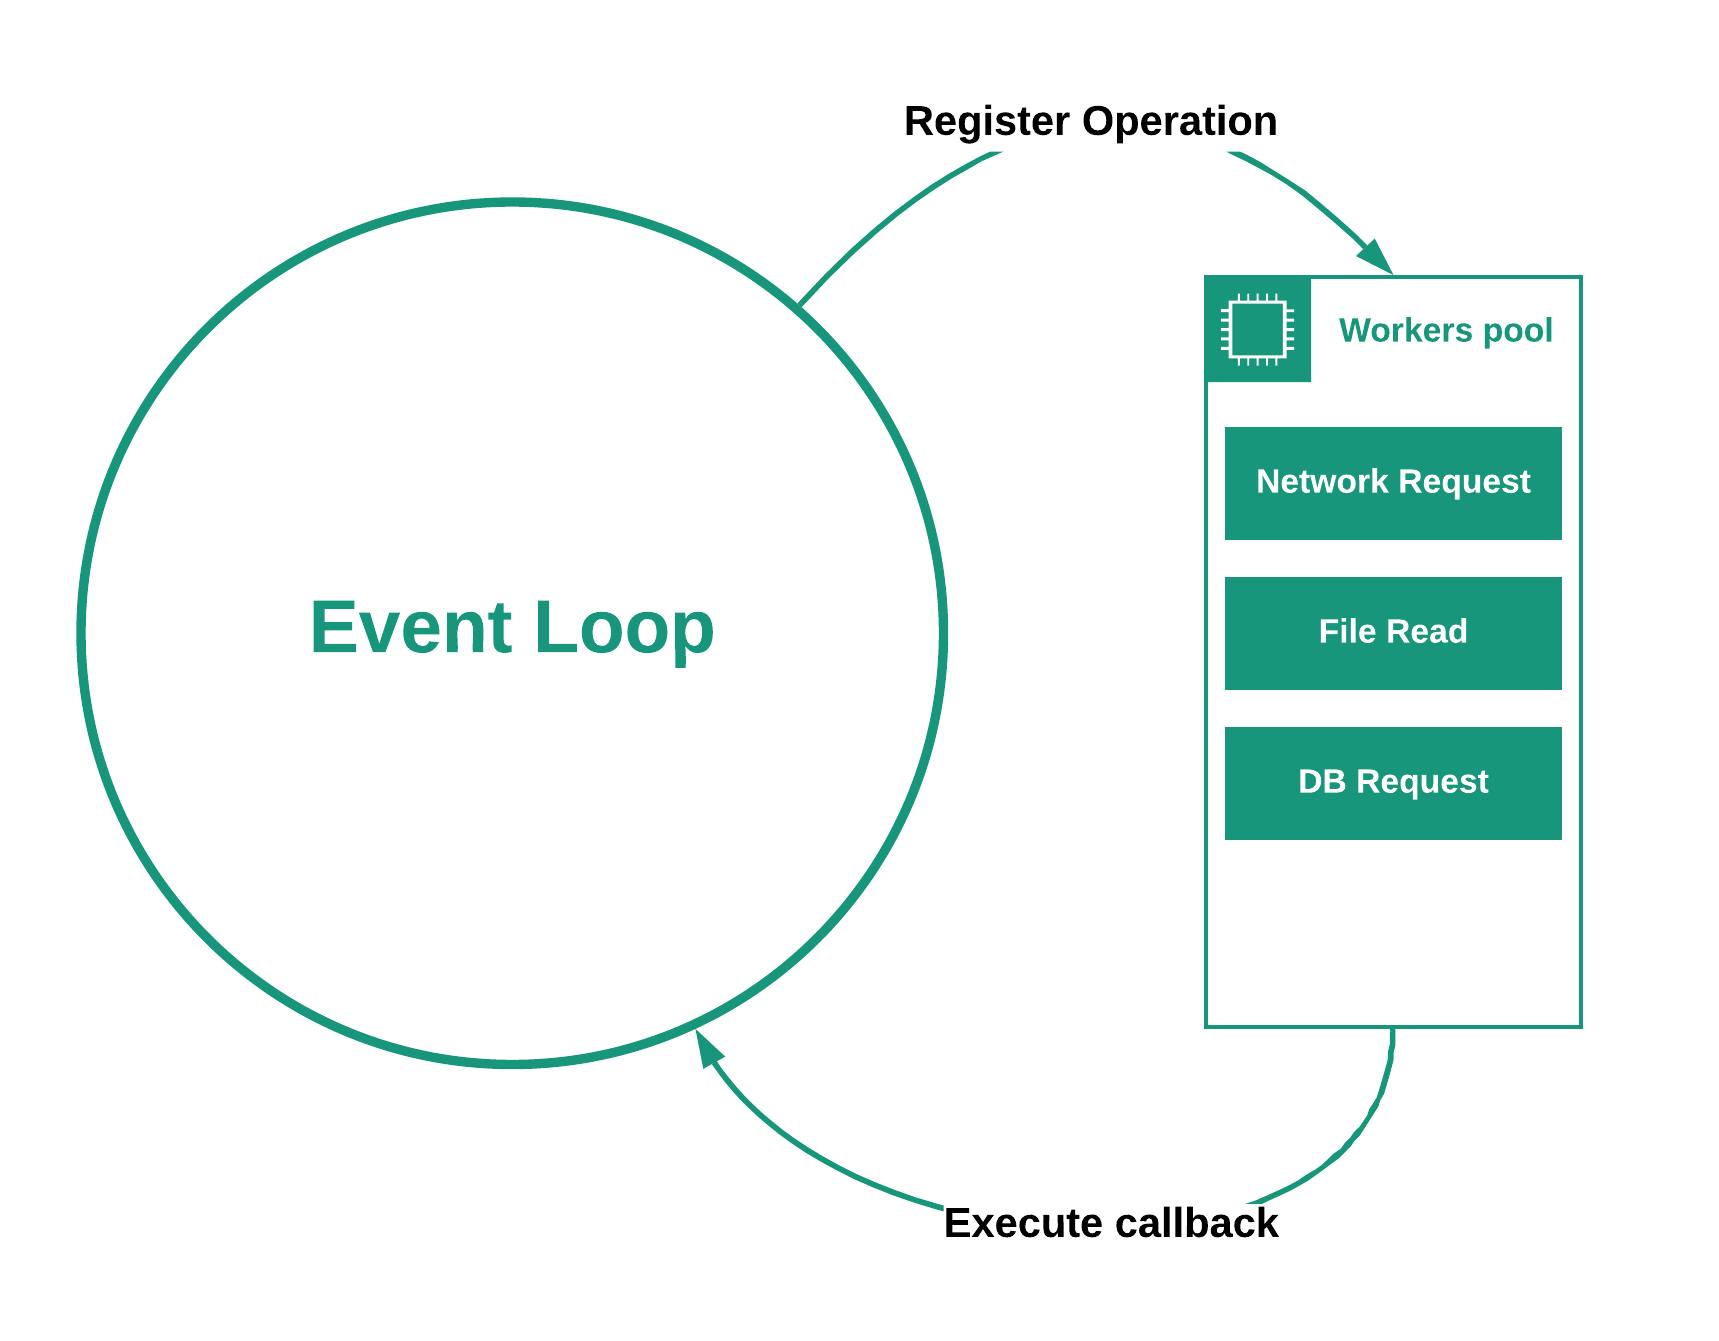
Asynchronous operations are (vastly simplifying the term) a way of handling long lasting operations, usually Input/Output, without forcing the main application process to stop and wait for the operation to finish. This is especially popular in Node.js ecosystem (or JavaScript in general), where the whole server runs on single process, so it would be extremely inefficient to force it to stop and wait for every network request or disc read.
By making the operation asynchronous, Node.js can process other upcoming tasks, while the long lasting operation is in progress. This is a very useful and widely used technique that allows single process to effectively server multiple requests.
With Lambda however, it's different. Single instance of Lambda function does not handle multiple requests at once. Every request, or event, triggers a separated function execution. If the available Lambda function is busy, service will scale and create another instance. This means, that particular Lambda execution context, will not accept new request, until all operations of the previous request (asynchronous or not), are finished.
Does it means that asynchronous operations bring no advantages for applications running on Lambda? Yes and no.
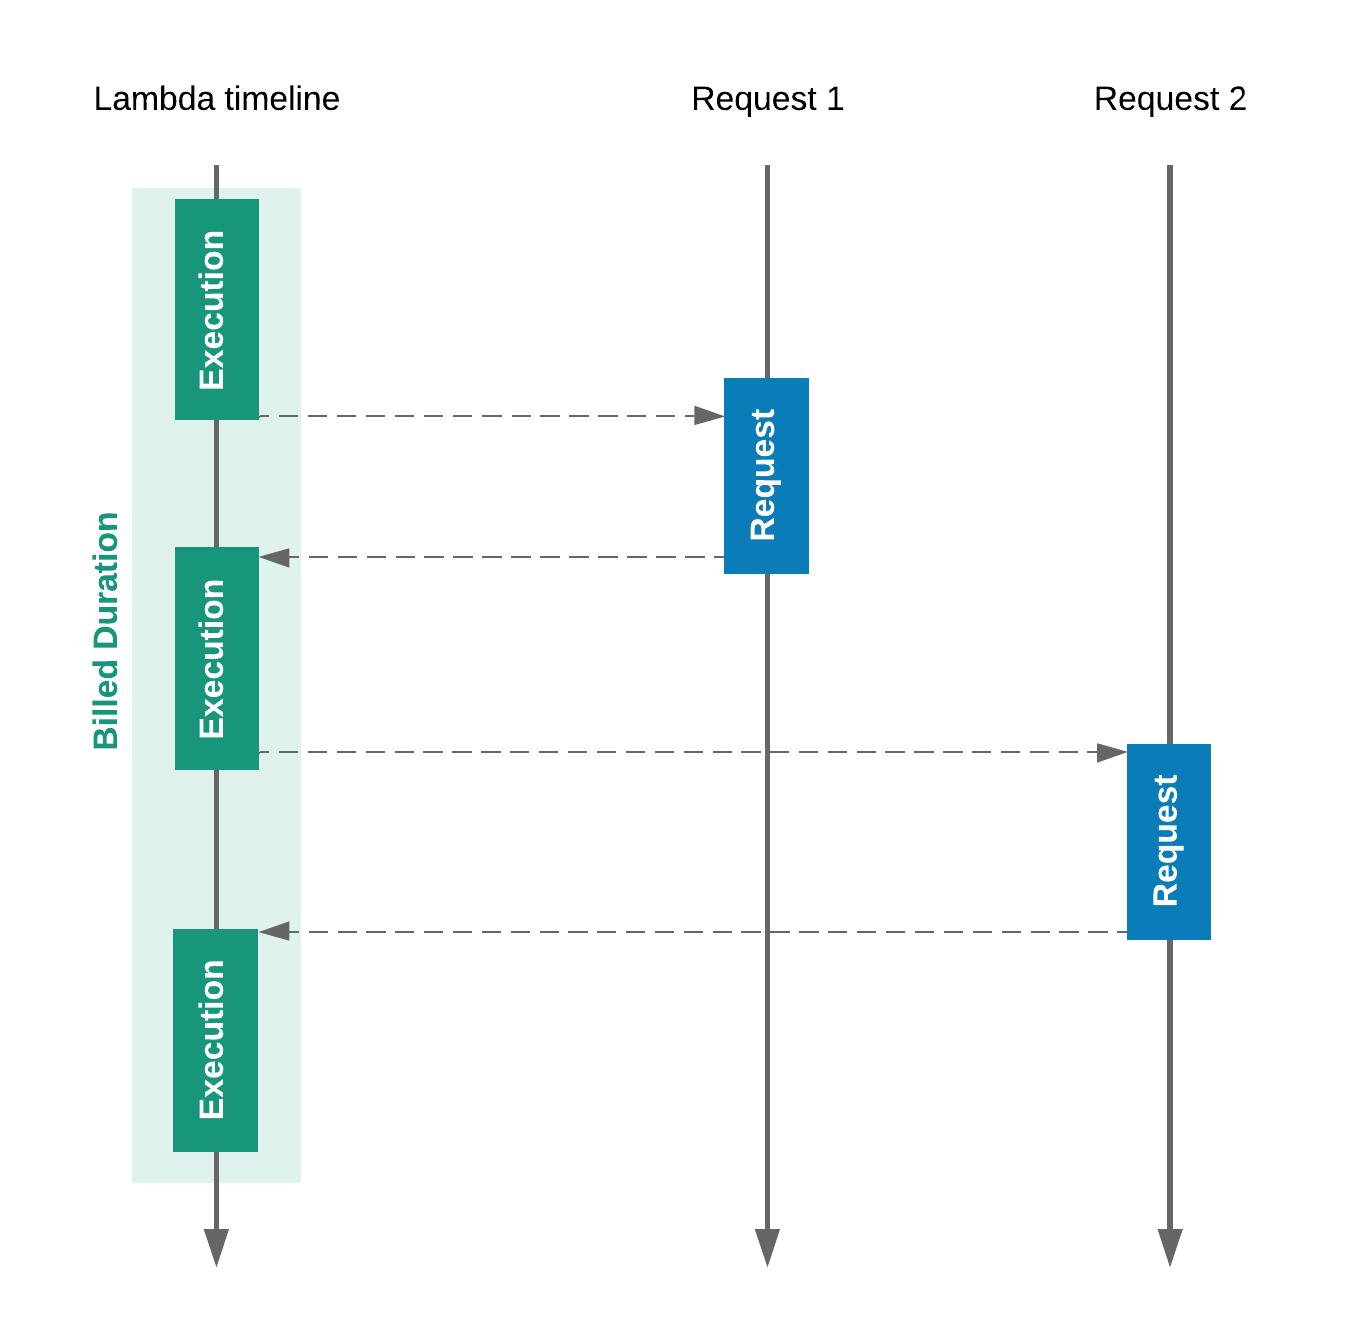
It does not change anything if you only make one async operation per invocation call, or you have to run many of those one after another. In such case, you will see no benefits using asynchronous code and the execution time of your function will be defined by the sum of requests duration.
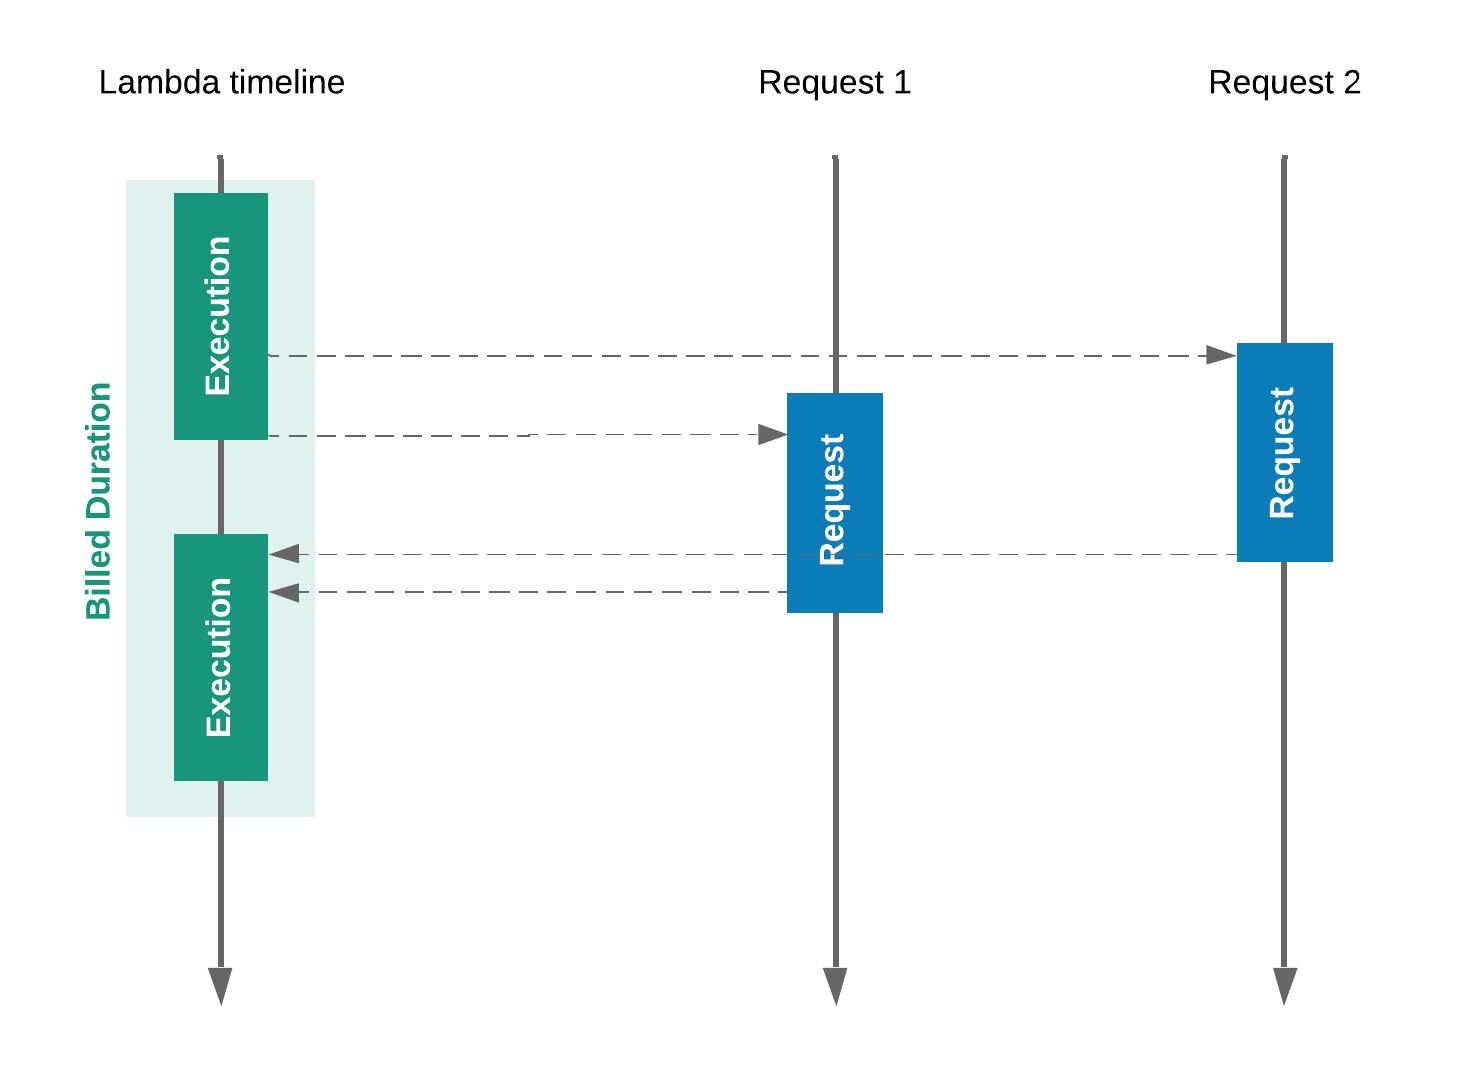
But, asynchronous approach will be beneficial, if those operations can be run in parallel. Then, you can start all those requests at once, perform other operations, and finish when all asynchronous requests are done. In such case, you execution time will be affected only by the slowest of those requests.
Avoid waiting
Remember, that even when your function does nothing and waits for the asynchronous operation to finish, it still cannot handle new requests and the waiting time still counts as an execution time. Even if your function is not performing any operations, just waits, Lambda will still bill you for that time. Therefore, it's best to avoid at least reduce the number of I/O operations as much as possible.
It can be done by taking a proper approach when defining application architecture and by using batch operations when possible. Let's take DynamoDB for example. Every DynamoDB operation, done from inside Lambda function, is in fact a http request being sent. So, simply putting 5 items in a table, one by one, means 5 separated requests that you have to wait for.
    dynamoDB.puItem(item1, (err, data) => { /* callback */ }); // request 1
    dynamoDB.puItem(item2, (err, data) => { /* callback */ }); // request 2
    dynamoDB.puItem(item3, (err, data) => { /* callback */ }); // request 3
    dynamoDB.puItem(item4, (err, data) => { /* callback */ }); // request 4
    dynamoDB.puItem(item5, (err, data) => { /* callback */ }); // request 5
Instead you can use batchWriteItem method, that will save all those records in one request.
dynamoDB.batchWriteItem(allItems, (err, data) => { /*callback*/ }); // single request
Latter is not only faster, but also much easier to manage.
Avoid asynchronous operations
What if you could avoid asynchronous, long-lasting, network-based operations at all? Why should you pay for the time your code is just waiting for the network request to finish? Especially if you are communicating with other AWS services. Let's imagine, you have a fairly simple case, when user uploads a picture to your application, its data is stored in the DB, and an email is being sent when the operation is done.
If you would like to write such an application "the old way", it would probably look more and less like this:
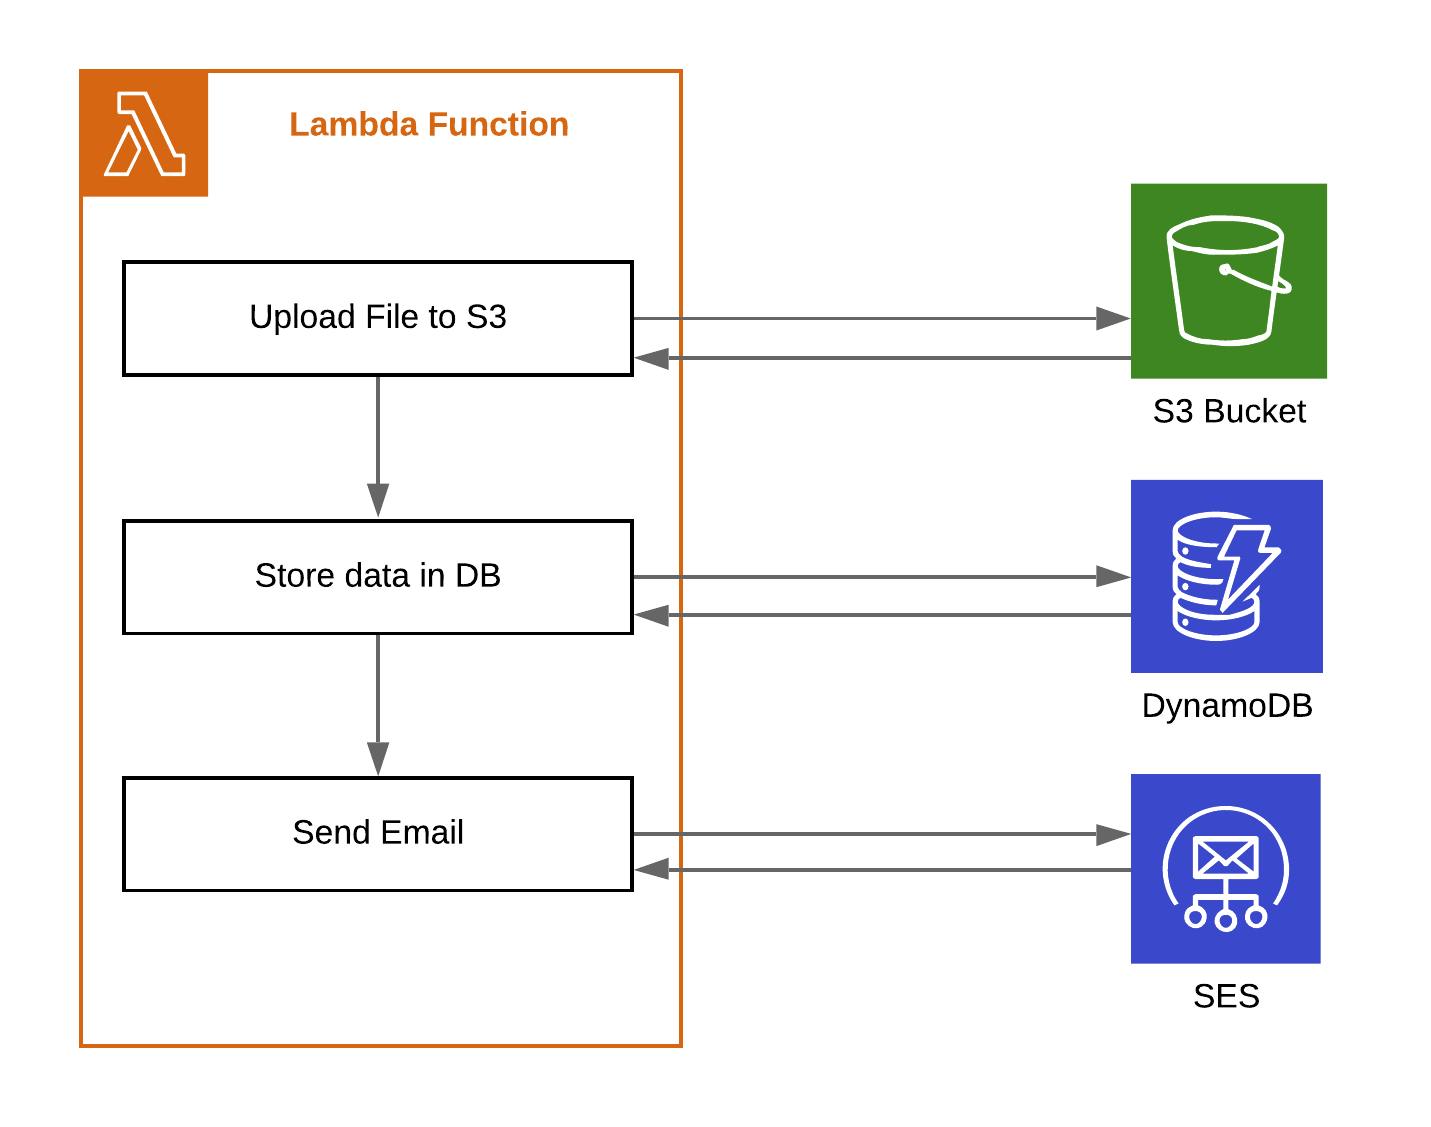
After reading through previous article parts, you probably already know that such architecture involves a lot of waiting for network requests. This is not optimal, since you actually pay for waiting until other AWS services do their job.
But how can we tackle this problem? Most of those requests cannot be just parallelized, since we need the results of the previous operation in order to start the next one.
The key here is to approach this problem with a different mindset. Writing serverless application, we should focus more on writing "a glue" , business logic combining existing managed services to achieve desired results, instead of manually handling requests.
Our application can be redesigned to leverage existing AWS connectors and events emitted by services.
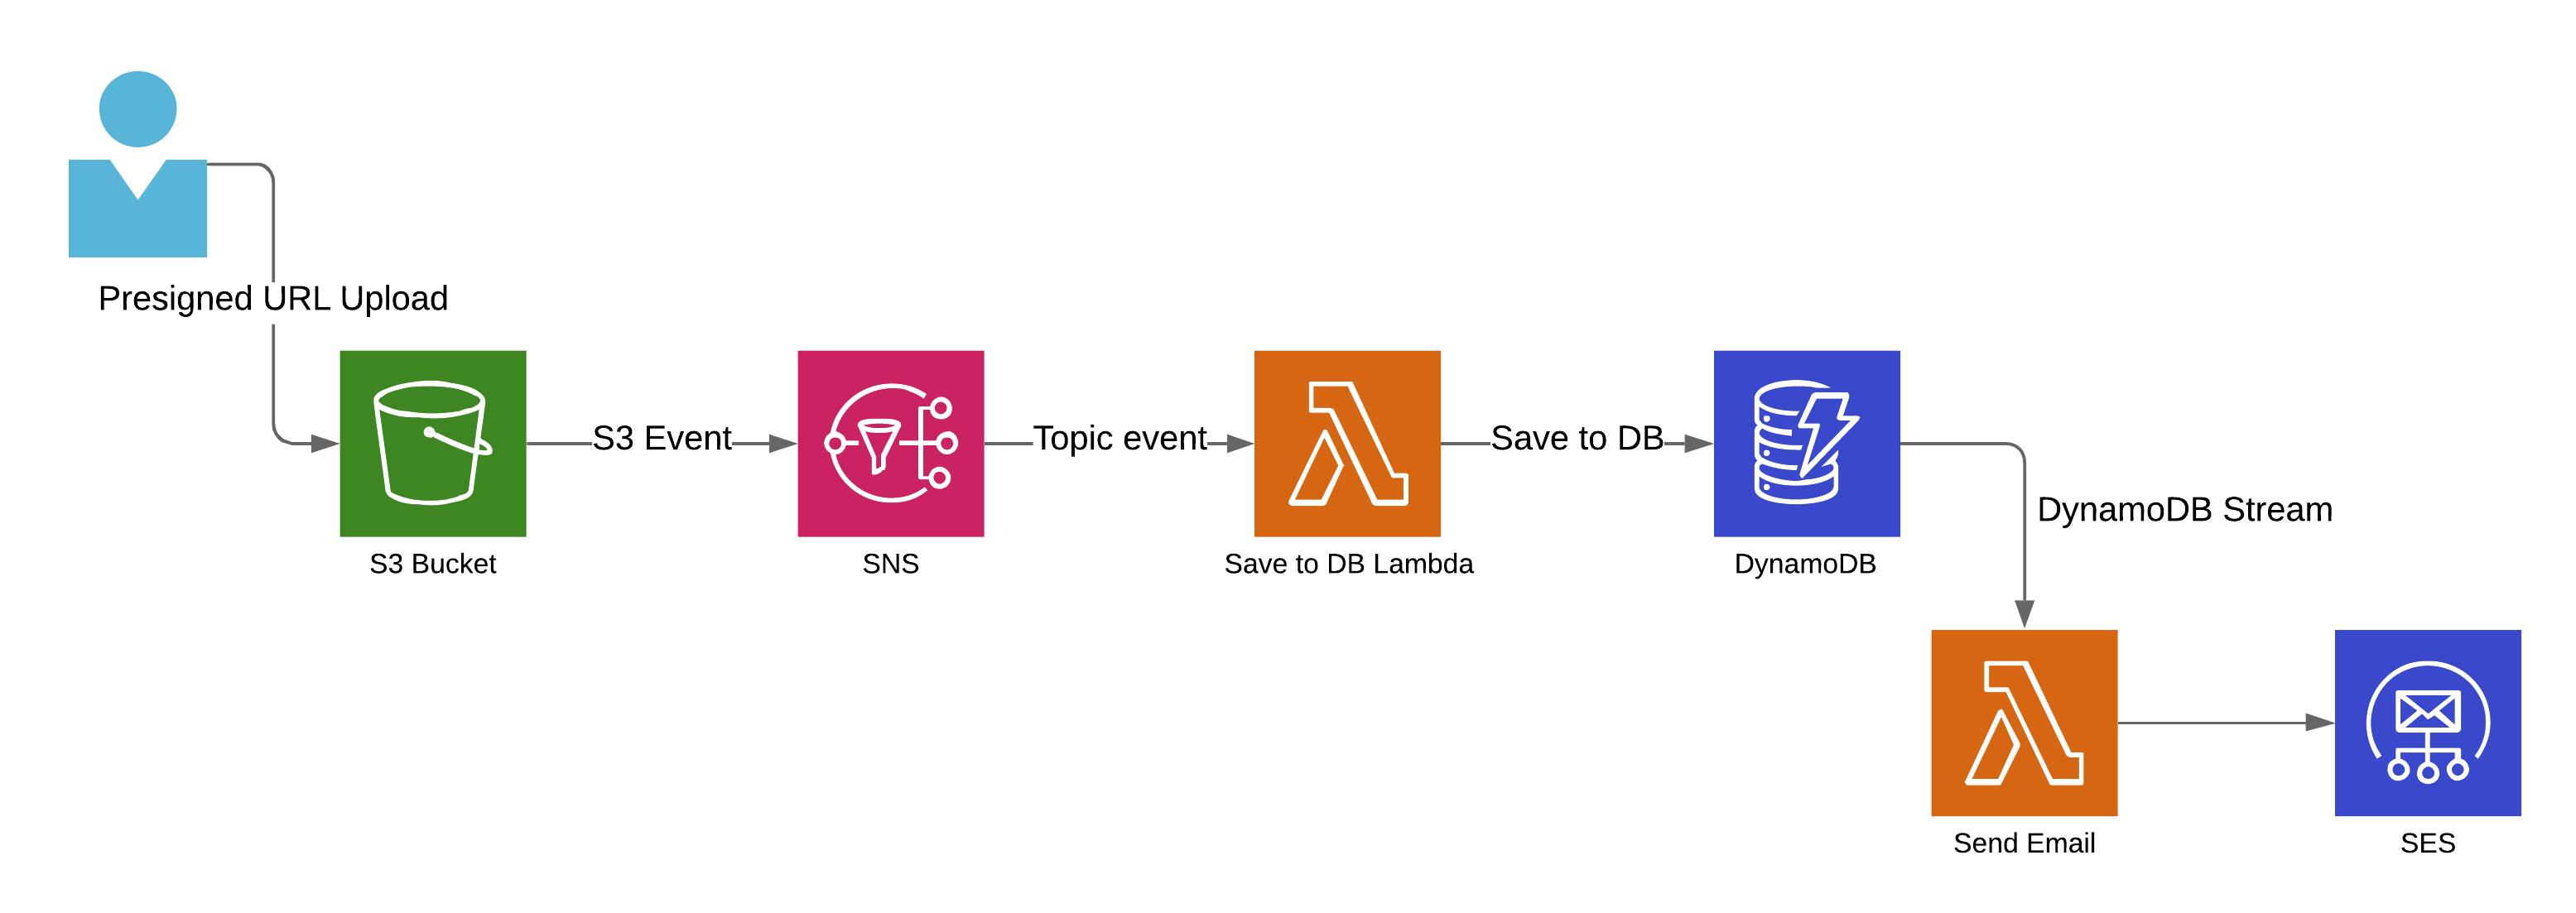
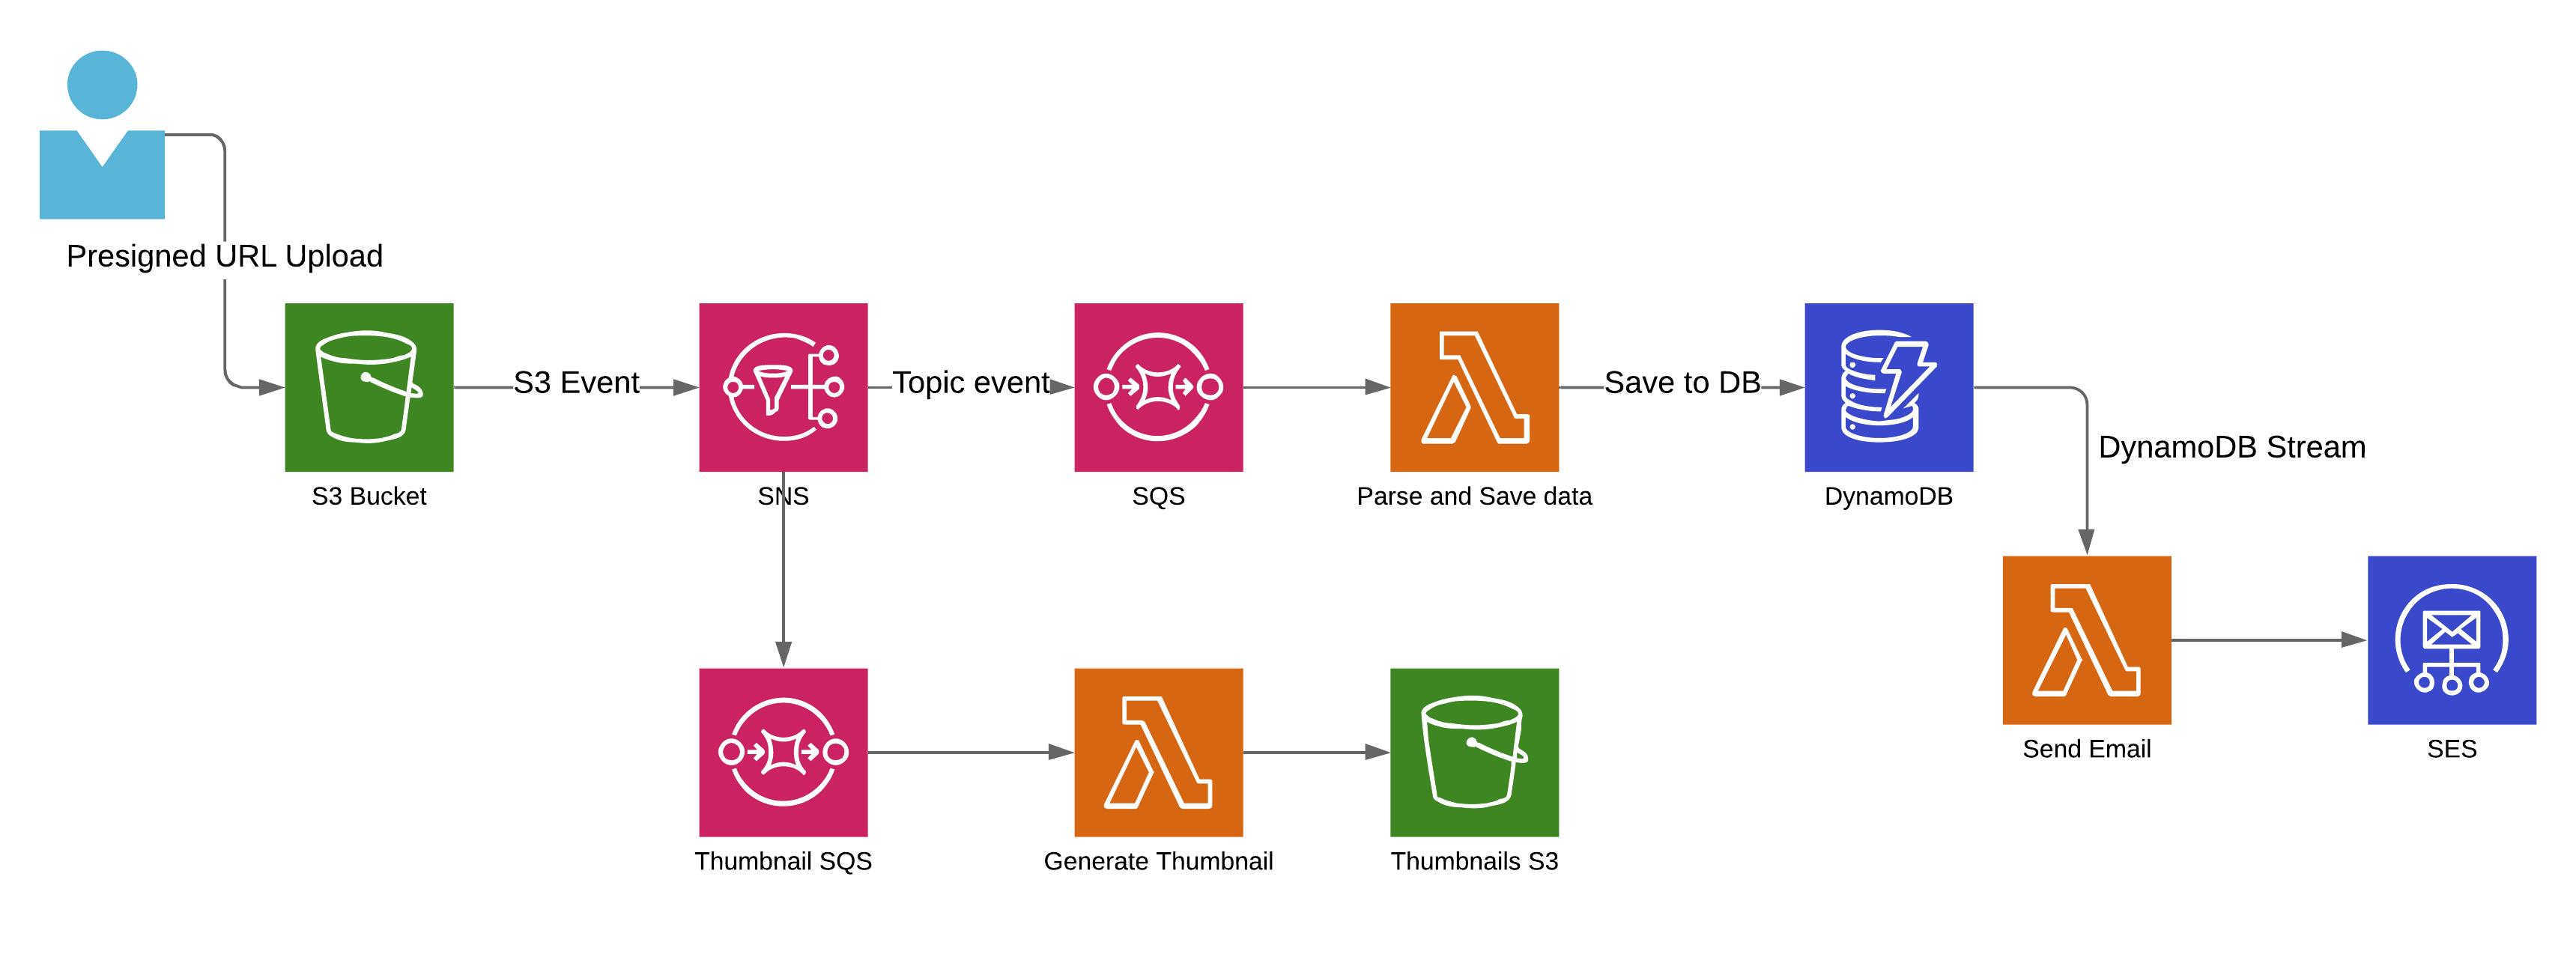
Let's summarize shortly how application building blocks cooperate:
- We are using S3 Presigned URL, that allows user to upload file directly to S3 bucket, it means that the whole uploading process does not even go through Lambda function
- S3 buckets emits an event to SNS topic, after file is uploaded
- Lambda subscribes to SNS topic and when triggered by an event, saves file meta data to DynamoDB
- Once DynamoDB record is created, lambda connected to DynamoDB streams, is triggered, with a newly added record, and used to sent email via SES
As you can see, we've eliminated most of the waiting time, by leveraging events triggered by AWS services. What's more, this architecture is not only efficient, but also more maintainable and should scale easier. Put SQS queue in between SNS and Lambda, and you additionally increase resiliency of you app and ability to handle unsuspected peaks of heavy workloads. If you would like to generate thumbnail of an added file, you simply connect new Lambda to SNS topic and store the results in S3. You Lambdas in such architecture receive events from one AWS service, execute small pieces of business logic and handle the data to another part of data flow chain.
While this approach may seem over complicated at first, it starts to feel natural after some time. Remember, that the whole idea of serverless applications is based on the assumption, that the code layer is as small as possible, and serves mostly as a connecting layer, between managed cloud services.
Multithreading in Lambda functions
Languages that support multi threading can speed up code execution by parallelizing some task and utilizing multiple cores of the processor. While Lambda runtime supports operations on multiple threads, some limitations apply here.
As stated previously, amount of CPU power assigned to the function depends on the amount of assigned memory, starting with a small chunk at 128 MB to 1,792 MB where Lambda gets the full vCPU core. Above that level, additional vCPU cores will get assigned to your function.
With this in mind, we can predict that multithreading will only improve Lambda performance if you assign more then one virtual core to the function (more than 1,792 MB of memory). Below that level, you can still use threads in your code, but execution will not be parallelized. Actually, the overhead caused by threads management might even result in longer execution time when compared to single-threaded code.
Single thread limitations
Let's take a very naive function, written in Go, as an example. The code below just run some sha256 hashing, on a content of a file, in two, synchronous loops. Performance of this Lambda handler is purely limited by CPU power, so it should serve as a good visualization of Lambda CPU management.
    import "crypto/sha256"
    // ...
    func doHashing(file []byte) {
        for index := 0; index < 100; index++ {
            sha256.Sum256(file)
        }
    }

    var fileContent []byte
    func init() {
      // file is read during Lambda initialization, to minialize it's effect on handler performance
        res, err := ioutil.ReadFile("text_file.txt")
        fileContent = res
        if err != nil {
            log.Fatal(err)
        }
    }

    func LambdaHandler() (int, error) {
      // create 2x100 hashes synchronously, one after another
        doHashing(fileContent)
        doHashing(fileContent)
        return 0, nil
    }

    func main() {
        lambda.Start(LambdaHandler)
    }
Now we can run this function with different memory settings
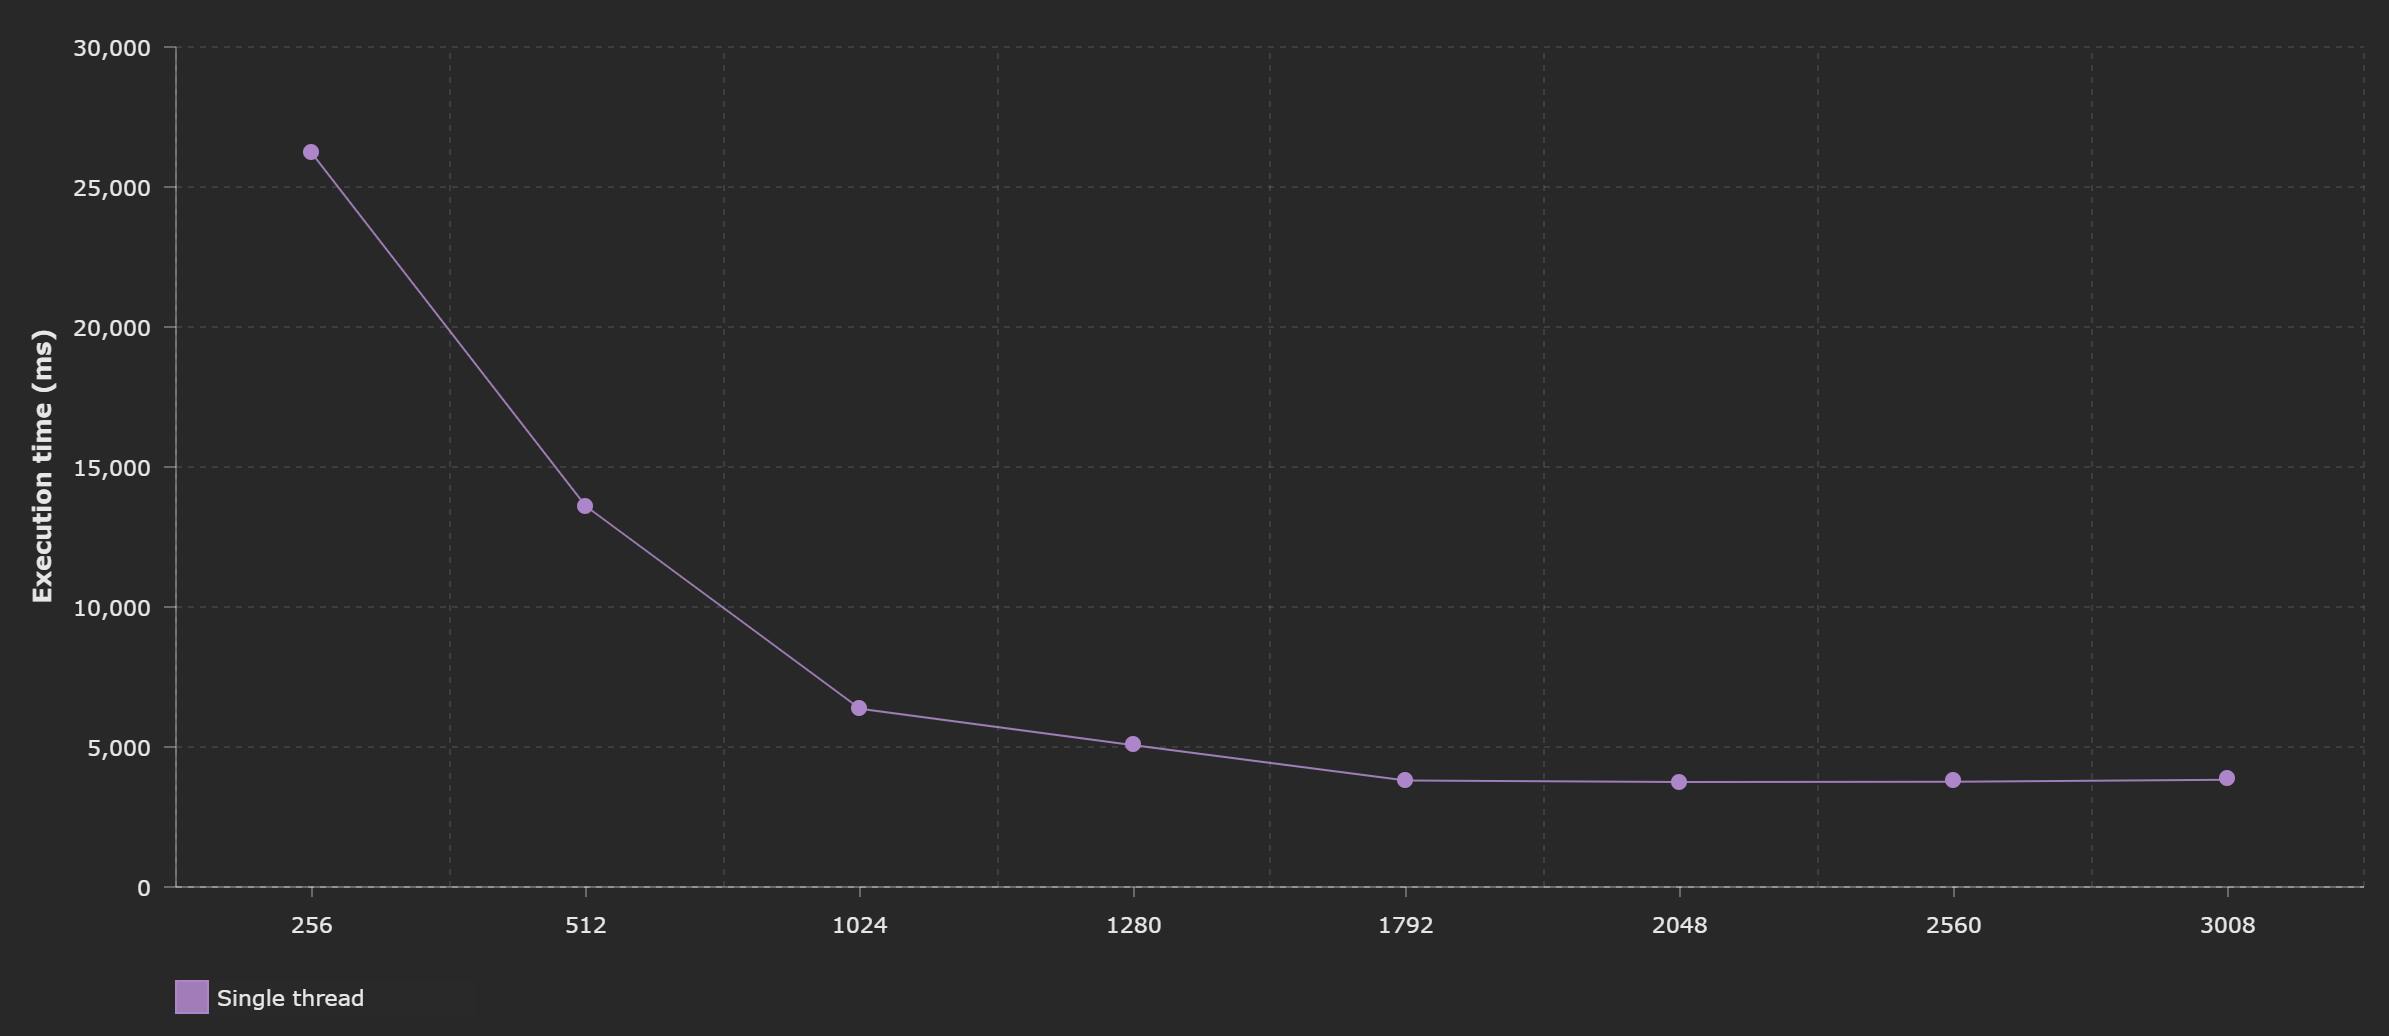
On the graph, it's clearly visible, that available CPU power only grows to the limit of 1,792 MB of memory configured (which translates to full vCPU core being assigned to the function). Everything above that results in more cores being added, but it does not further increase the computation power of the first core.
This means, that if your function code is entirely single threaded, you will not see any performance improvements above 1,792 MB level. You will however see increased execution costs.
Multi threading performance example
Now, let's take the same function code, but make it multi threaded with go routines.
    func doHashing(file []byte) {
        for index := 0; index < 100; index++ {
            sha256.Sum256(file)
        }
    }

    var fileContent []byte
    func init() {
      // file is read during Lambda initialization, to minialize it's effect on handler performance
        res, err := ioutil.ReadFile("text_file.txt")
        fileContent = res
        if err != nil {
            log.Fatal(err)
        }
    }

    func LambdaHandler() (int, error) {
      // now those two functions will be run on two separated threads
        go doHashing(fileContent) //this function will be executed on a separated thread
        doHashing(fileContent)
        return 0, nil
    }

    func main() {
        lambda.Start(LambdaHandler)
    }
And the execution time for different configurations looks like this:
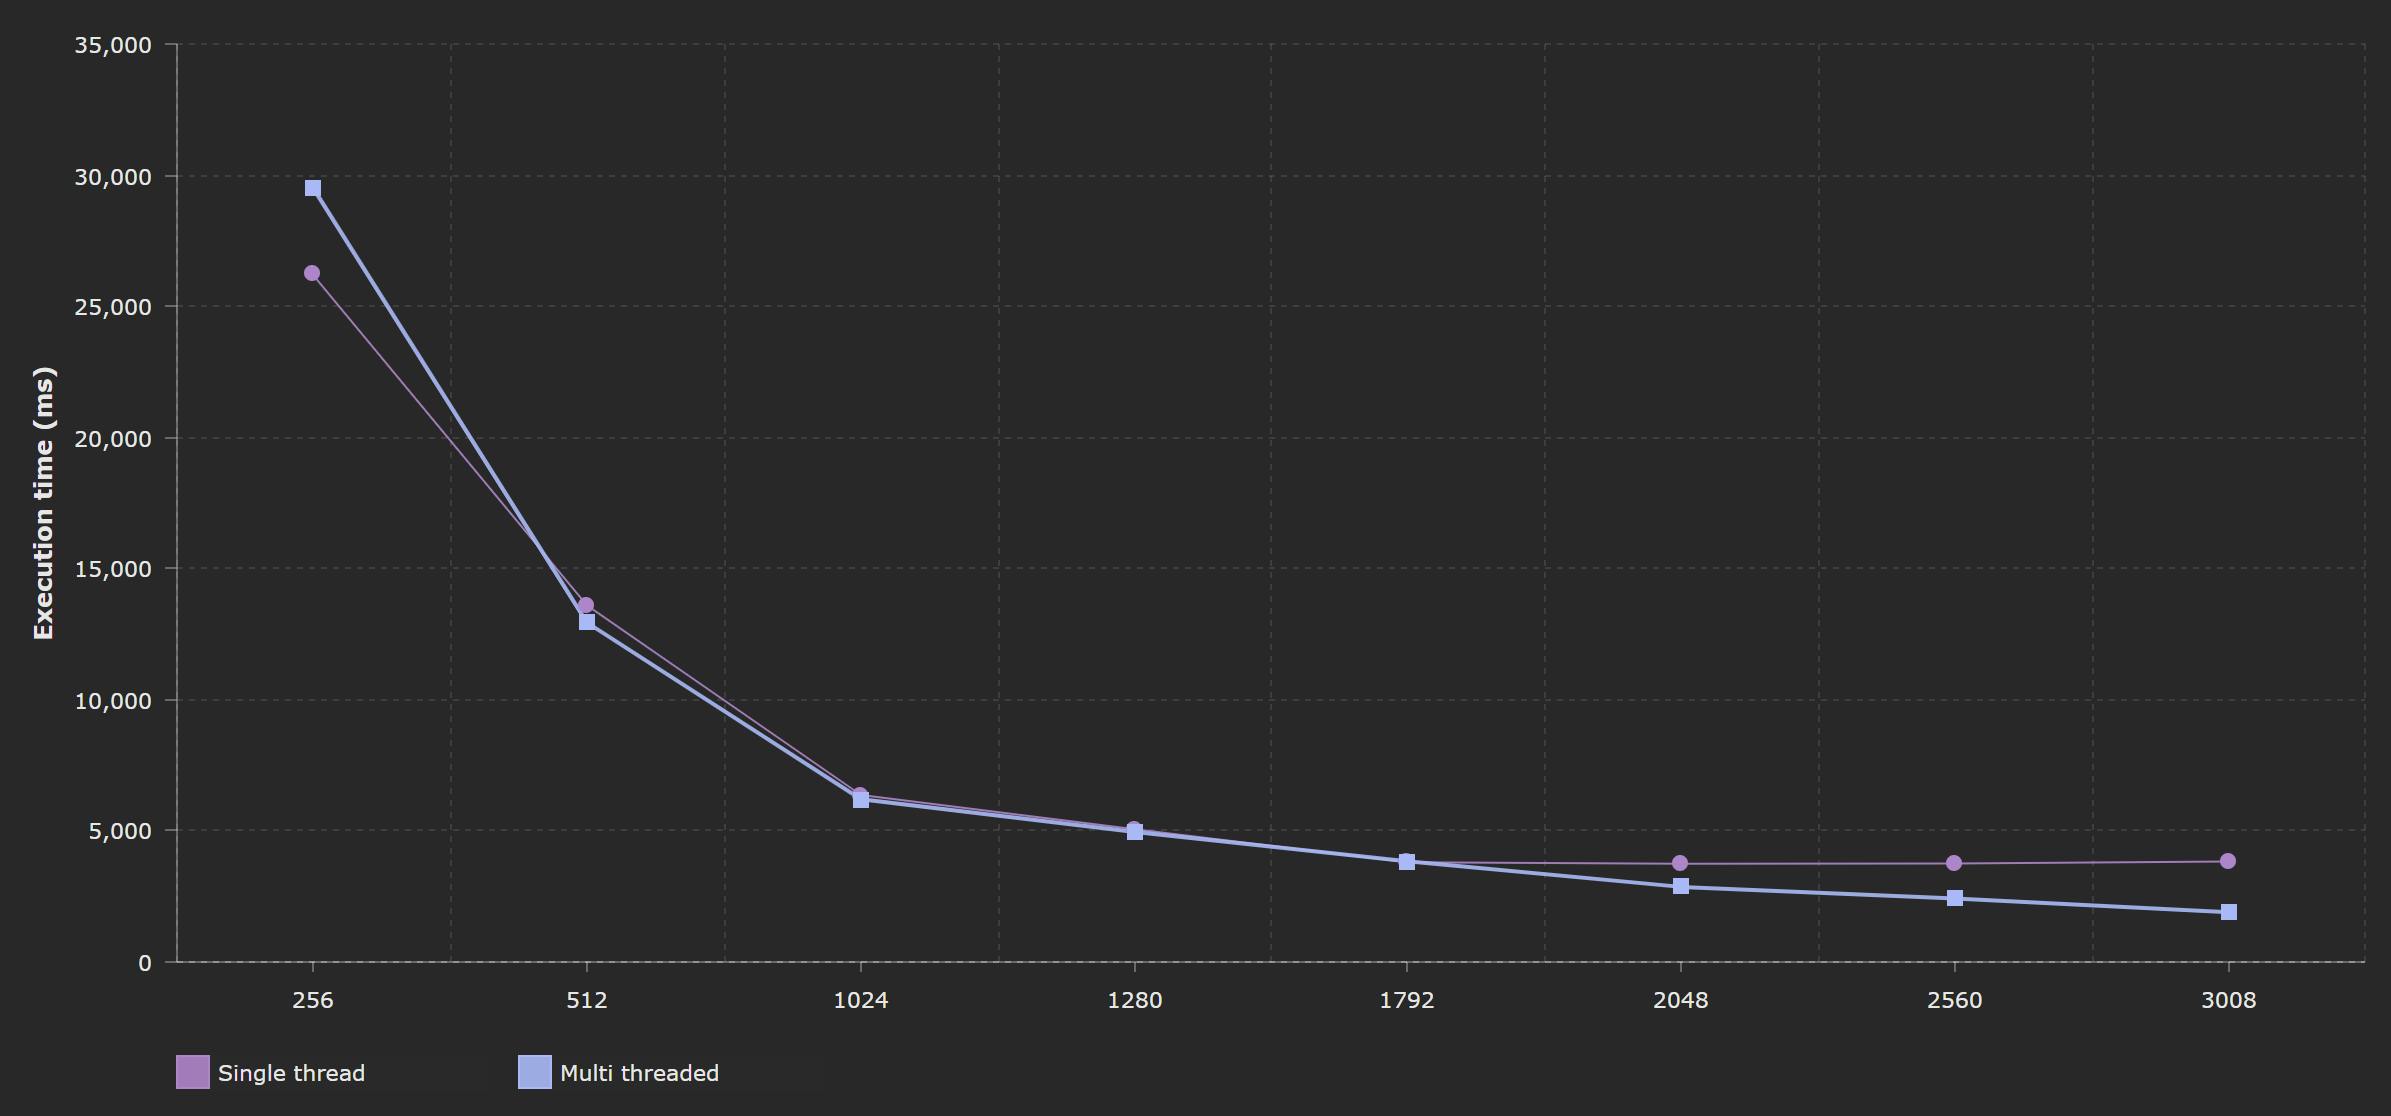
Now, the execution time drops when the amount of assigned memory increases. Up to 1,792 MB results for single and multi threaded code are very similar, since on a single core, multiple threads cannot run in parallel. Only, above that level is when you can see the difference, additional core allows the multi threaded code to be run in parallel, which gives a visible boost of the function performance.
Code and package structure
There are few more aspects that you should pay attention to when working on your serverless application.
It's a structure of your code and a size of your lambda package. Both will affect the time your function needs to initialize.
Keep you handler as small as possible
Let's take a look a the example of basic function that reads the data from DynamoDB and returns the list of records.
    const AWS = require('aws-sdk');

    export.handler = async (event, context) => {
        const dynamoDb = new AWS.DynamoDB({apiVersion: '2012-08-10'});
        // ... define query params
        const records = await dynamoDB.query(params).promise();
        // ... return records as a response
    }
To understand what's wrong with this code, you have to be aware of what's the difference between cold start and warm starts. You can find the details here, however, what matters now is to distinguish code that is executed during the initialization phase vs code executed with every request.
The handler function here is executed with every upcoming request, every new event passed to Lambda is handled by a separated handler execution. Everything outside of handler function, is only executed when the new runtime is being created, during so called cold start or initialization phase. Since the runtime is not destroyed after every execution, but reused between subsequent requests, consecutive handler executions have an access to the variables created during the initialization phase (like variable AWS in the example above).
You might have noticed, at that point, what's wrong with the code above. DynamoDB connection is created with every handler invocation. While technically correct, this is a suboptimal implementation. DB connection does not have to be created for every invocation, we can create a single connection instance during the function initialization phase, and then just reuse it in the handler.
    const AWS = require('aws-sdk');
    const dynamoDb = new AWS.DynamoDB({apiVersion: '2012-08-10'});

    export.handler = async (event, context) => {
        // ... define query params
        const records = await dynamoDB.query(params).promise();
        // ... return records as a response
    }
Above version will initialize the DB connection during the cold start of a function, and a handler will reuse it when processing the event. Since you can expect that handler will be called multiple times per one cold start (exact numbers are very hard to predict and are based on multiple factors), this implementation is much more efficient.
General rule is to remove from handler all the code that is not directly related to processing of a particular event. Any connection initialization, configuration loading / parsing, libraries initialization etc. should be called outside of handler, during the initialization phase.
Be careful though, since if you extract to much logic out of your handler function, you might introduce not-so-easy-to-spot bugs to your code. Let's look at an example with random number generator based on some seed value.
    const gen = require('random-seed');
    const seed = createSomeFancySeedValue();

    export.handler = async (event, context) => {
        const randomValue = gen.create(seed);
        console.log(`Random number: ${randomValue}`);
    }
Moving seed generation outside of handler might seem like a good idea from the performance point of view, but in fact, it's breaking the whole functionality of the function, since seed value stays the same across multiple handler calls, which will result in "random" value being the same every time.
Reduce the size of you code package to reduce cold start time
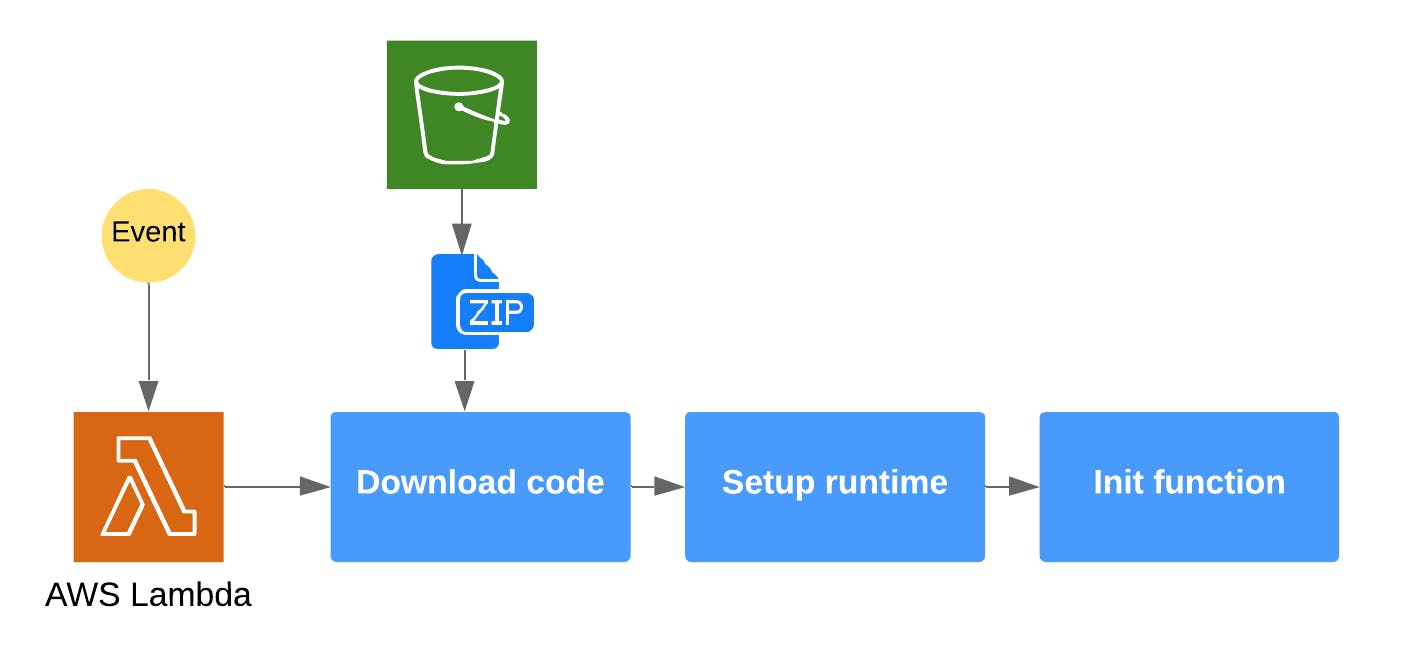
Lambda function is being deployed as a zip file that contains all the code and resources needed for function to execute. This package is being stored in the S3 bucket. When Lambda cold starts a new runtime environment for the function, it downloads the file, unzips it and executes the code. The bigger you package is, the longer it takes Lambda to download it and the longer you will wait for your function to initialize.
There is no magic tricks here. Make sure that the package is as small as possible. Reduce the number of your dependencies, make sure that you don't use overpowered libraries and frameworks, keep the things simple and delegate the responsibility to managed AWS Services where possible.
If you are using Node.js, be mindful about your node_modules directory. Make sure that for the deployment, you only package the dependencies needed for production build. Try to remove unnecessary files using tool like node-prune.
Provisioned concurrency
Recently, on re:Invent 2019, Amazon has presented new functionality that might help us optimize our Lambdas performance. It's Provisioned Concurrency for Lambda Functions.
In short, it allows you to pre-initialize a requested number of execution environments, that will always stay "warm", regardless from you current workload. With such setup, requests routed to those instances, will not suffer from cold start latency, since Lambda will not have to create new runtimes from scratch. If the workload exceeds the number of provisioned environments, Lambda will just scale as with any other workload.
This setting is especially useful, when you know that you can expect some defined number of requests for your Lambdas, and you would like to prioritize the response time (with a cost of additional numbers on your bill).
Conclusion
As you can see, there are multiple techniques that you can use, when optimizing your Lambda functions. As with every optimization, not every technique has visible effects all the time, but it's important to keep in mind the specificity of Lambda environment and restrictions that applies there. Also make sure that you evaluate the potential gains of the optimization process, since sometime the amount of work might not be worth the resulted execution time improvements. At the same time, hours of advanced code optimization might not give you the same performance benefits as rethinking your architecture approach and shifting it towards event driven "code as glue" architecture.
You can read this post on Dev.to